
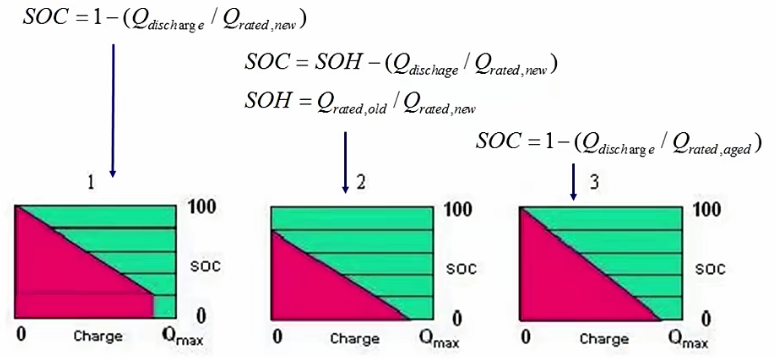
1.1 Definition of Battery State of Charge (SOC)
Definition 1
After aging, the maximum discharge capacity is lower than the rated capacity of a new cell, preventing SOC from reaching 0%.
Definition 2
After aging, the scaling factor a < 1, preventing SOC from reaching 100% during charging.
Definition 3 (Preferred)
SOC dynamically adapts within the full 0–100% range, eliminating the limitations described above.
Why Definition 3 Is Preferred
Enables online capacity estimation (SOH-aware)
During aging, the OCV–SOC curve remains largely invariant. Using the relationship ΔSOC = ΔQ / current, SOC variation can be directly linked to current throughput, providing a solid foundation for State of Health (SOH) estimation.
Intuitive and user-aligned
SOC = 100% at full charge and SOC = 0% at depletion, aligning with real-world user expectations.
Robust temperature behavior
Experimental data shows that for lithium manganese oxide (LMO) cells, OCV–SOC curves above 0 °C nearly overlap. Special handling is only required at extreme low temperatures (e.g., −20 °C).
Cell-to-cell consistency
Cells with the same chemistry and production batch exhibit nearly identical OCV–SOC curves, even with capacity dispersion or different aging levels.
1.2 Why Battery Modeling and State Estimation Matter
Battery variables are categorized into:
Directly measurable states (primary variables):
Terminal voltage, current, cell/ambient temperature, and time—captured via sensors.
Non-measurable states (latent variables):
SOC (State of Charge), SOH (State of Health), SOP (State of Power), and SOE (State of Energy). These cannot be directly measured and must be estimated algorithmically. They define the battery’s true performance and safety envelope.
Core Concept
Battery modeling builds a mathematical representation of the system. Under identical current input and operating conditions, the model output (voltage, temperature) is compared against real measurements. The resulting error is used to iteratively correct:
- Model parameters
- Internal states (SOC, SOH, SOP)
Requirements for Accurate State Estimation
- Known initial conditions
- High-fidelity battery model
- Real-time estimation algorithm
Convergence Mechanism
Estimation is driven by error feedback. When internal states deviate from reality, discrepancies appear in voltage and temperature. Minimizing this error over time drives the model toward the true internal state. Once the error converges to near zero, the model output becomes a reliable proxy for the actual battery condition.
1.3 SOC Estimation Methods
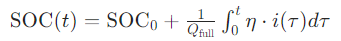
1.3.1 Coulomb Counting (Current Integration)
Based on charge conservation, SOC is calculated by integrating current over time relative to initial SOC.
Advantages
- Simple and computationally efficient
- Easy to implement in embedded systems
- Fast dynamic response, suitable for real-time tracking
Limitations
- Error accumulation over time (sensor drift, integration error)
- Highly sensitive to initial SOC
- Impacted by capacity fade (aging)
1.3.2 Open Circuit Voltage (OCV) Method
SOC is inferred from the nonlinear mapping between OCV and SOC after the battery rests long enough to reach equilibrium.
Advantages
- Very high static accuracy (error < 0.5%)
- Independent of current measurement errors
Limitations
- Requires long rest periods (>30 minutes)
- Not suitable for dynamic conditions
- OCV–SOC curve varies with temperature and aging
1.3.3 Electrochemical Impedance Spectroscopy (EIS)
SOC is estimated from impedance characteristics across frequencies, including charge transfer resistance and diffusion effects.
Advantages
- Captures electrochemical and diffusion dynamics
- Sensitive to temperature and aging
- Enables multi-parameter estimation
Limitations
- Expensive instrumentation
- Difficult to deploy in real-time automotive BMS
- Complex impedance–SOC relationship
1.3.4 Data-Driven (AI-Based) Methods
Includes Neural Networks (NN), Support Vector Machines (SVM), and LSTM models trained on large datasets.
Advantages
- No need for explicit physical models
- Handles strong nonlinearities
- High accuracy under dynamic conditions
Limitations
- Requires large, high-quality datasets
- Computationally intensive
- Generalization depends on training data coverage
1.3.5 Filtering-Based Methods
Includes Kalman Filter (KF), Extended Kalman Filter (EKF), and Unscented Kalman Filter (UKF), combining prediction and correction steps with equivalent circuit models.
Advantages
- Handles noise and system uncertainty effectively
- High accuracy in dynamic conditions
- Can jointly estimate SOC and internal states
Limitations
- Depends on model accuracy
- Sensitive to initial parameters
- Requires adaptive tuning
Industry Practice
Production BMS solutions typically combine coulomb counting and OCV calibration with filtering algorithms—forming a hybrid approach:
“dynamic tracking + periodic recalibration.”
1.4 Battery Modeling Framework
Battery models are generally divided into three domains:
Electrical Models
Describe the relationship between current excitation and voltage response. Used to predict terminal voltage under load.
Thermal Models
Capture temperature dynamics driven by electrochemical reactions and internal resistance.
Aging Models
Describe performance degradation, primarily:
- Capacity fade
- Internal resistance growth
1.5 OCV–SOC Characteristics
Under ideal conditions, OCV and SOC exhibit a one-to-one mapping:
- SOC represents remaining charge (0–100%)
- OCV is measured after sufficient rest (no polarization effects)
This relationship is a key input for equivalent circuit models and SOC estimation algorithms.
Practical Considerations
Hysteresis effects
Lithium iron phosphate (LFP) cells exhibit strong hysteresis:
- Charge and discharge OCV curves do not overlap
- Transition behavior is nonlinear and path-dependent
Chemistry-dependent behavior
- LMO / NMC: steeper OCV curves → easier estimation
- LFP: flat plateau → requires advanced modeling
Non-instantaneous transitions
When switching from charge to discharge, voltage transitions gradually rather than instantaneously, reflecting internal electrochemical dynamics.


Very good i like it
wish you all the best